Hi, I’m Meghna.

I like Systems.

I love People.

In work and in life, I try not to get the two things confused. I believe that technology is equally capable of fulfilling and frustrating human needs and that being thoughtful and compassionate is what can make the difference.


Contact via LinkedIn
Resume
Most Recently At
The New York Times
Helping readers manage their New York Times experience.
Fjord Design
Dug deep into enterprise healthcare, Helped invent the future of cruise ships,and planned the launch of a 100% EV car brand in the U.S. & China.
Recurse Center
Built an interactive web journey to study front-end development and visual storytelling.
School for Poetic Computation
Built an installation on personal narratives of climate-change that visualized climate data for impact.
Professional Project
Health Insurance
Role: Interaction Designer
About The Project

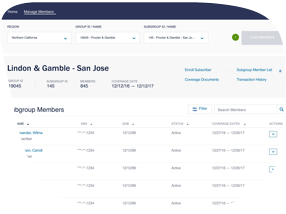
An award-winning healthcare company needed to re-invent their enterprise enrollment and management system to increase self-service and reduce support overhead.

Product Design / Enterprise / Accessability / Usability-Testing

Case Study
Professional Project
Carnival O.C.E.A.N.
Role: Service Designer, Interaction Designer
About The Project

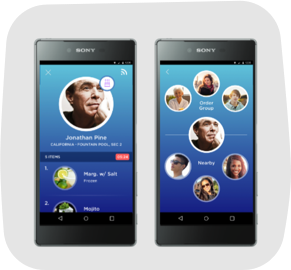
The world's largest cruise operator had a vision for bringing magical experiences to the high-seas. Our team focused on designing back-stage systems for staff to streamline, enable, and support more personalized experiences for guests.

Immersive Research / IOT / Service-Design / Personalization
Independent Project
Dust, Dust
About The Project

Dust,Dust is an interactive web-narrative I made during a fellowship at the Recurse Center in NYC in Fall 2019. I designed and built it using p5.js.

It was an exercise in visual storytelling inspired by Scott McCloud’s Understanding Comics and my love of typography. All the visuals in it are built out of type.


Check it Out
Independent Project
Diagrams from Life
About The Project

"Systems generate patterns. They’re like a secret spine beneath the world lending form and shape."

This book & website are a collection of data-paintings I made in the six months after turning 27. I was interested in:
  1. 1. How to represent data in a meaningful and aesthetic form

  2. 2. How to represent data that was personal, biased, and deliberately vague.
My data was not taken from tracking-analytics or wearables, but from memories, conversations, and personal-beliefs. The fuzziness is inherent.


Learning About

5 Best from 2019

Understanding Comics Learnable Programming Algorithms to Live By Why We Sleep The Tyranny of Structurelessness

← AMAZING for all storytellers

← What you actually do when you code.

5 for 2020

How To Do Nothing Lathe of Heaven The Color of Law Art of Memoir Geek Sublime